Introduction:
 |
| Figure 4 (Wolfpaving Orthomosiac) |
§ What is Pix4D?
In this week’s lab, we experimented with the software program Pix4D. Pix4D is a program that takes up to thousands of images to generate one detailed 2D/3D image. It automatically converts images taken by drones, by hand, or by plane. And finally, it presents profoundly clear, georeferenced 2D maps and 3D models. Some products that it generates are cities, forests, farms, and much more. During the process of this week, we used our previously used Wolfpaving data to create a 3D animation of the area. Pix4D is an essential tool for UAS data processing because of presentation purposes. Having a 3D model accessible to show clients problems/ situations dealing with the terrain can be easily viewed and comprehended.
Methods:
Factors that should be considered when designing an image acquisition plan?
- Representation of terrain/object to be restored.
- Ground Sampling Distance (GSD): This will determine flight height the equipment was flown at during a mission
- Overlap: The overlap depends on the kind of terrain that is mapped and the speed at which the images are taken
o Image Acquisition
When designing an image acquisition plan, one of the most prominent things to note is what type of terrain/ object you will be reconstructing. The image acquisition plan has a high impact on the quality of work that you will produce. Another factor to consider is using a grid image acquisition because it helps with increasing the overlap to have clearer results. Lastly, when designing an acquisition plan it is recommended that you fly higher during a mission because it improves your results when making a map.
o Overlap
Figuring out how much overlap you should set during the creation of a project is important to know the quality of your project. Before you start the process of combining all the pictures together, you should open all the images up and take a look at what you captured. Scanning through the images can make you see which ones were good and which ones will fall nicely with one another. During this lab assignment, we had 21 images to work with and you can see that all 21 images were used and worked thoroughly together. By opening up these images we can visually check how well the overlap is and if it was imminent enough.
Bare minimums for overlap front and side
The general bare minimum for overlap is as follows:
- 75% frontal and 60% side overlap in general cases.
- 85% frontal and 70% side overlap for forests, dense vegetation, and fields.
- There is an increased need for the dense forest because how the number of objects that are included in the picture. The more there is, the more overlap we will need to clearly define the vegetation.
- 85% frontal overlap for single-track corridor mapping. Use a 60% side overlap if the corridor is acquired using two flight lines.
o Photo stitching vs. Orthomosaic generation
Photo stitching is only used for small data sets because it only works best on terrain that is nearly flat. This is because the process of this uses a method of gluing images together just like a puzzle. A low data set can be used because it only requires a low amount of matches or key points during the overlap process. Using this method on uneven terrain can lead to distortions and the whole data set gone to waste. Orthomosaic is based on a method called, orthorectification. This method consists of removing distortions from images using a digital surface model. This can only be done if the overlap was performed well and there is a high number of matches from picture to picture.
o Merging Projects
When comes to merging projects it can be useful for when working with different acquisition types in particular, terrestrial, grid and circular are practiced. It is also helpful for the process of reconstruction of an object using two different types of equipment to capture the image. (phone camera or a GoPro combined to make a 3D model.
o Difference between a Global and linear Rolling Shutter
 |
| Example Image of Global/ Rolling Shuter |
The difference between the global shutter and linear rolling shutter is dependent on how the image
is captured. As seen above, the global shutter captures the entire image at once, creating uniformity
throughout. While rolling shutter using progressive motion during it’s exposure time. This why
rolling shutter causes wrapping in an image as seen above to the right.
o GCPs necessary for Pix4D? When are they highly recommended?
Ground control points are points on a surface, anywhere on earth, that the point has a known location
and is used for geo-reference imagery. GCPs are not necessary for Pix4D but they are highly
recommended when using large data sets to make it easier to clearly define each point of interest
on the entirety of the image you are trying to create. In this week’s lab, we did not use GCPs because
this was an introductory lab for Pix4D and time permitting, we just needed to learn how to work
through the system and become proficient. Using GCPs will help define and link key points together
to produce a higher quality picture and will give a better quality report depending on the images that
were captured.
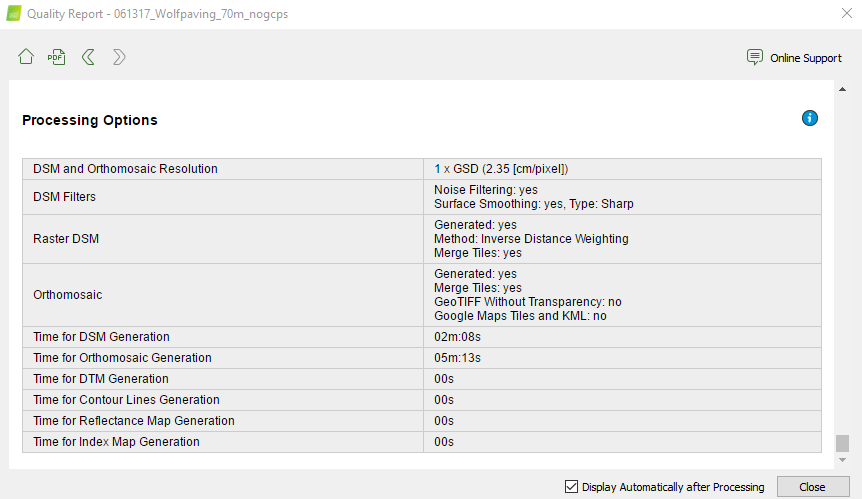
o Quality Report
During the processing report, once data has been run, a quality report is pulled up on the screen.
There are three steps taken during the processing stage. There are initial, point cloud/ mesh and
DSM/Orthomosaic for step three. Step one processing must be completed first and when it is finished,
we are given a quality report on the data that was processed. Some of the things (but not all) that are
included in a quality report are, a quality check, Preview, Calibration Details, Initial Image Positions,
Computed Image/GCP/Manual Tie Points Positions, Absolute Camera Position and Orientation
Uncertainties, Overlap, coordinate systems and much more (as seen in figure 1 & 2). It also tells you
how many of the pictures were able to be processed out of the images you used in the data set.
As I said above, we used 21 images and 21 images were all processed and used (none rejected).
Viewing the overlap from our Wolfpaving data set we can see at the edges of the map were where
there was poor overlap, depicted in yellow. This could be because it wasn’t the main area of focus.
Figure 3 (Animation)
 |
| Figure 1 (Quality Report) |
 |
| Figure 2 (Quality Report) |
Talking about voids again as we were processing, near the edges of the area that was photographed
were some gaps due to not enough overlay as the drone was capturing pictures. This was because
the edges weren’t the area of interest and more pictures were taken by the mounds to look for erosion
and possibles hazard areas. (Take a look at the animation.)
Differences between the DSM with no GCPs and last weeks lab with GCPs
Now moving back to using ArcGIS Pro we were able to use the data that was given a create a hillside
DSM. We can see that there is a difference in values between this generated DSM (figure 5) and the
one from last week’s lab (figure 6). This is because one was processed with GCPs and the other one
was not. When using GCPs we can get more accurate results because each point gets specific
coordinates including elevation to precisely show slopes and changes in terrain. By placing GCPs at
different elevations we can see the differences between each point and have a greater range between
slopes. This is why in (figure 6) there is a greater range between elevations than the one we produced
this week (figure 5).
 |
| Figure 5 (Hillsahde DSM without GCPs) |
 |
| Figure 6 (DSM with Slope & GCPs)
Conclusion:
Pix4D is a great tool to use when developing projects for commercial use. Bringing together UAS data and incorporating it into a 3D model can be an eye-opener. In this week’s lab, we were able to understand the components/ tools that are used in Pix4D and got develop a 3D animation of the area. We then transferred to ArcGIS Pro and developed a DSM to compare the DSM created from last week’s lab to see that difference in values based on using GCPs and not using them. Without using GCPs the processing time takes a lot less and gives a smoother look to your model. This is because there are no GCPs at different elevations to show precise differences. The more data you have, the longer the processing time it will take. So, you have to be patient and make sure that you do everything right the first time. |